


Stacking Portfolio Analytics
Market practitioners should stack portfolio analytics the same way tech firms stack software. Because component value compounds nonlinearly. Combining data and analytics with software is art. The resulting value created, its product, is science.
Stacking portfolio analytics is the art and science of performance.
Here is a stack of explanations.
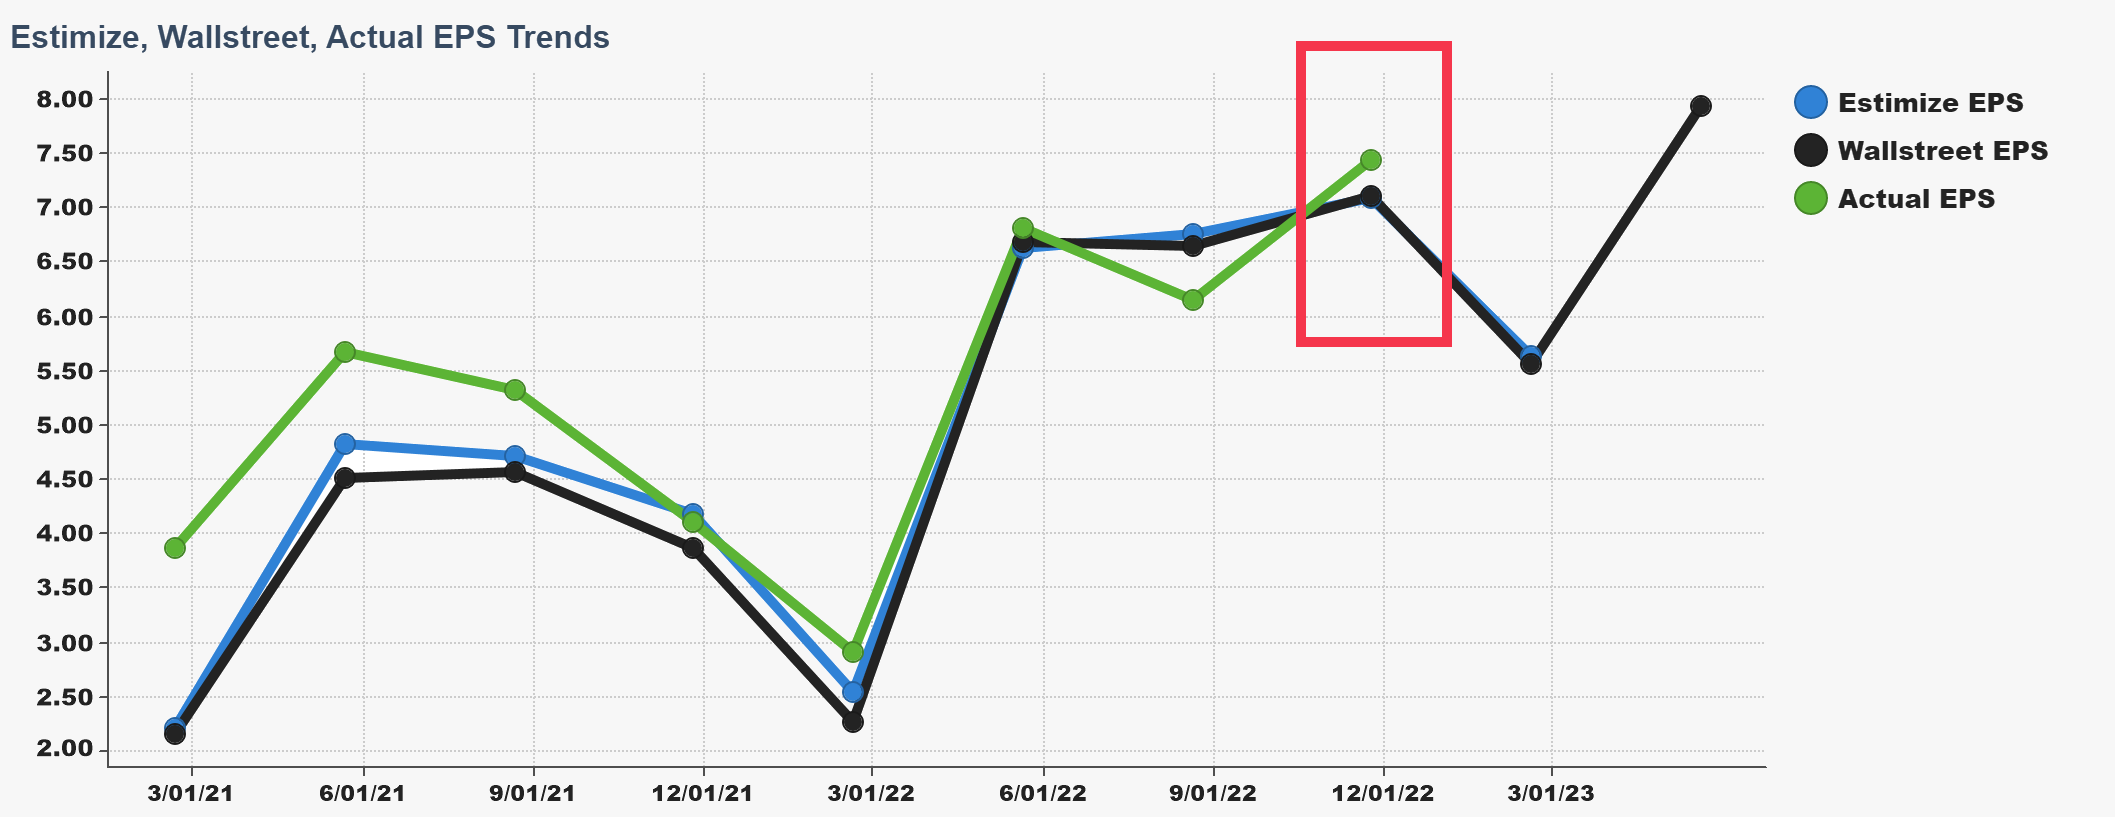
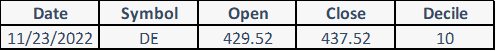
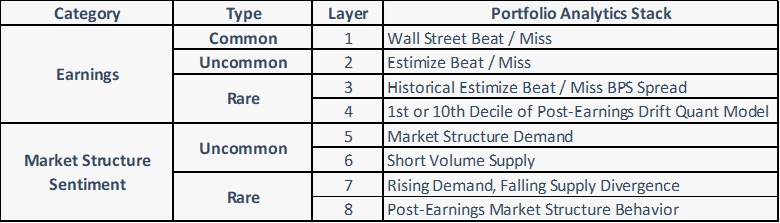
Earnings results are a baseline layer of market intelligence. Deere & Co. (DE), beat earnings expectations Wednesday, 11/23. Knowing that DE beat Wall Street estimates is common knowledge. Layer 1.
Knowing that DE beat Estimize estimates, a quantitatively superior reflection of future earnings relative to Wall Street, is less common knowledge. Layer 2.
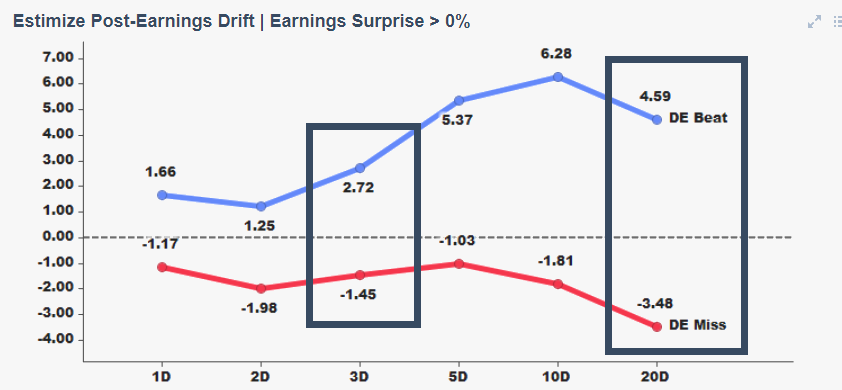
Knowing the historical 3-day performance spread between DE earnings beats and misses equals 385 basis points, and the 20-day performance spread equals 807 basis points is uncommon knowledge. Layer 3.
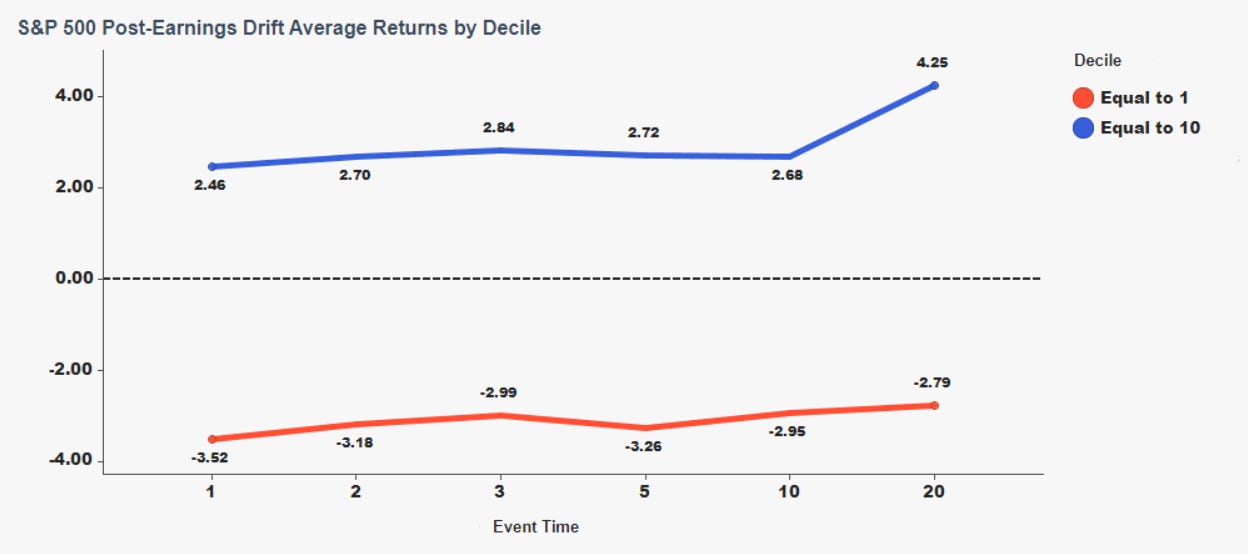
Knowing that DE EPS of $7.44 falls into a post-earnings drift quantitative model’s 10th decile is rare knowledge. The model classifies earnings releases by the statistical significance of upside beat and downside miss levels, relative to a universe of trailing 1-year earnings releases. When an S&P 500 constituent’s earnings release lands in the 10th decile of upside earnings surprises, the 20-day return is 4.25%. This is layer 4.
Layers 1 and 2 are interesting, descriptive analytics. Layers 3 and 4 are useful, prescriptive analytics. Because n the 20-day post-earnings period, buyers should tilt towards aggressive behavior and sellers should tilt towards passive behavior.
Portfolio analytic layers are additive quantitative evidence strengthening the probability that reweighting a portfolio towards DE will improve performance. And because post-earnings drift performance is relative, it is probabilistically prudent to likewise reweight portfolios away from companies landing in the 1st decile of downside earnings surprise misses.
Stacking portfolio analytics is stacking probabilities together to gain an edge.
Now, let’s stack market structure analytics on earnings analytics. Market structure sentiment is an entire category of uncommon knowledge.
Preceding the 11/23 earnings release, market structure demand for DE bottomed twice. Uncommon knowledge, but layer 1.
And short volume fell from 56% to 36%, a 35% drop in market-maker willingness to sell short DE. Layer 2.
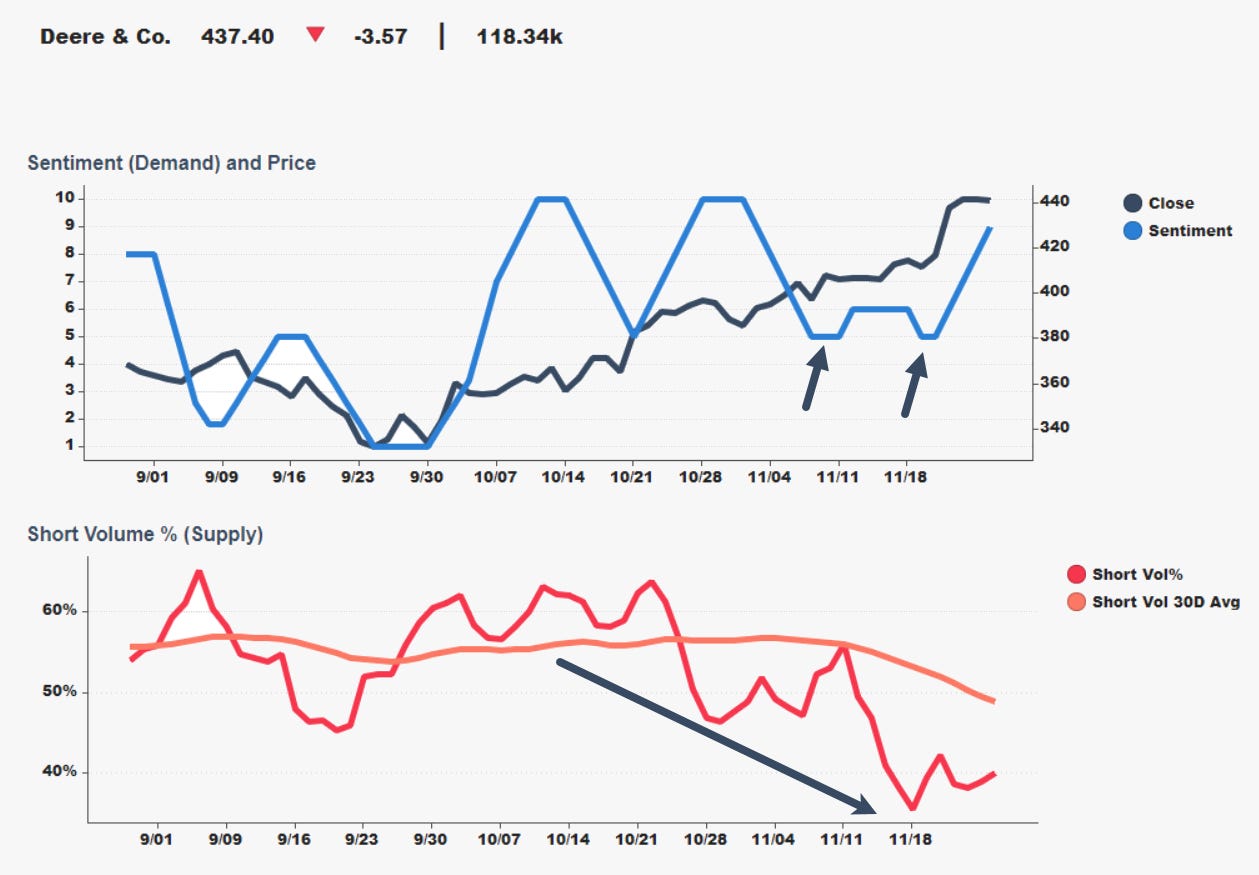
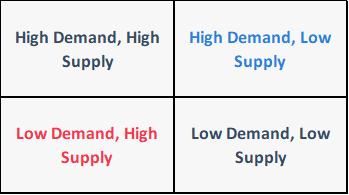
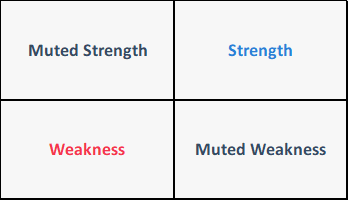
In the post-earnings drift period, DE had rising demand and short volume 30% below its 30-day trend. Its rising demand and falling supply diverged sufficiently to land in the strength quadrant of our market structure distribution for the S&P 500. Layer 3.

Market structure sentiment is the best measure of price setting behavior. Market participants reinforced the statistical likelihood that DE would make gains through its earnings release.
When DE reports we stack 4 layers of market structure analytics onto 4 layers of earnings analytics. After earnings, the post-earnings drift model and market structure profile developments further stack probabilities in one’s favor.
Without stacking, we only know that DE beat estimates. By stacking, we know that DE beat estimates in a statistically meaningful way while possessing a strong market structure behavior profile.
Stacking portfolio analytics improves decisions that affect positions, weights, and aggressiveness. Entries and exits. Performance and risk management.
The final product of which is AUM. A non-trivial performance measure.
Portfolio analytic stacks move you from common knowledge to rare signal.
.png)


