


Blind Spots & Information Asymmetry
The best asset managers are smart enough to know they’re dumb.1
Pie charts usually suck. Humans aren’t designed to interpret relative sizes of angular shapes. 80% of pie charts should be bar charts. Most of the rest shouldn’t be charts at all.
It is a rare scenario when a pie charts is the best way to interpret data. And even then, the pie chart can usually be constructed in one’s mind, without financial technology.
Consider a pie chart representing the probability of a coin toss result. A circle split equally between heads and tails. Symmetry.
Now consider a pie chart representing what we know, “knowns” and what we do not know, “unknowns”. The unknown pie slice dwarfs the known pie slice. Asymmetry.
The giant unknown slice can itself be split into known-unknowns and unknown- unknowns. Things we know we don’t know. And things we don’t know we don’t know. Finally, a useful 3-slice pie chart. I won’t present it here because you can see it in your mind’s eye.
Known-unknowns and unknown-unknowns span a spectrum of blind spots from information disparity to information asymmetry. In asset management and in life, the greater the asymmetry, the greater the blind spot.
Blind spots are risk. And opportunity.
Let’s consider some market information in the context of knowns and unknowns.
Market Behavior
Knowns: volumes, prices, and related liquidity metrics.
Known-unknowns: market participant behavior and activity. Demand, supply, behavior, and divergence.
Unknown-unknown: amplitude scores.
Market behavior equilibrium is a measure of stock strength and weakness derived from market structure physics: regulations, incentives, participant behaviors, and activity. Amplitude scores measure a stock’s distance from equilibrium. Market behavior equilibrium information can be used in pre-trade preparation, through-trade execution, and post-trade performance reporting. Amplitude scores provide behavioral strength and weakness information that enhance program trading outcomes.
Monitoring equilibrium creates information value about price-setting behavior that affects volumes, prices, and volatility. Equilibrium can be observed as demand and supply rising, falling, diverging, and converging across market, index, portfolio, industry, and sector classifications, as well as by stock. It is a critically important dimension of trade flows.
In the visual below, equilibrium scores identify the S&P 500’s extreme positive and negative demand supply divergences (disequilibrium). Knowing market behavior characteristics across portfolios, sectors and securities highlights risky positions and enables managers to improve trading strategies to produce better economic outcomes.
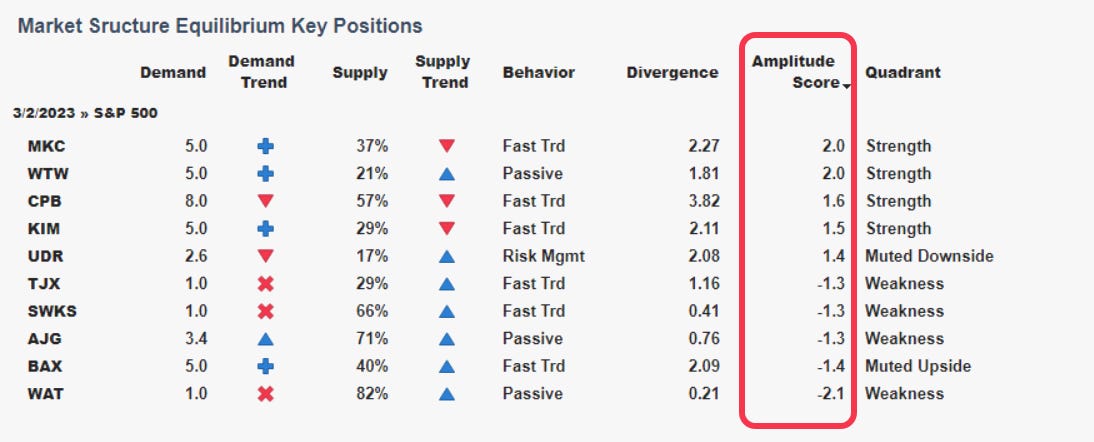
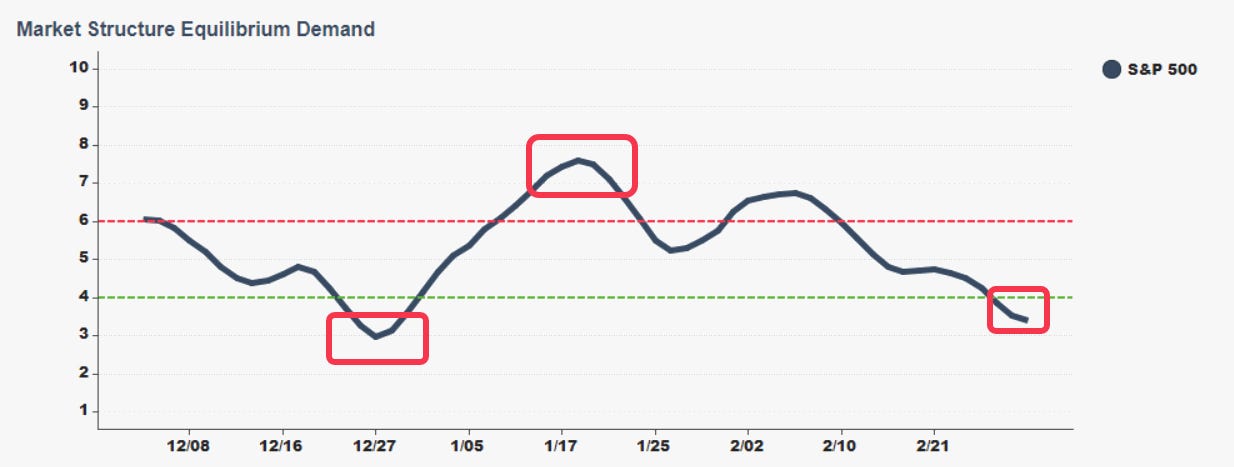
Demand and supply trends signal equilibrium danger zones that further inform trade implementation. The likelihood of gains falls as demand rises above 6 on its 10-point scale. Similarly, the likelihood of losses falls as demand falls below 4.
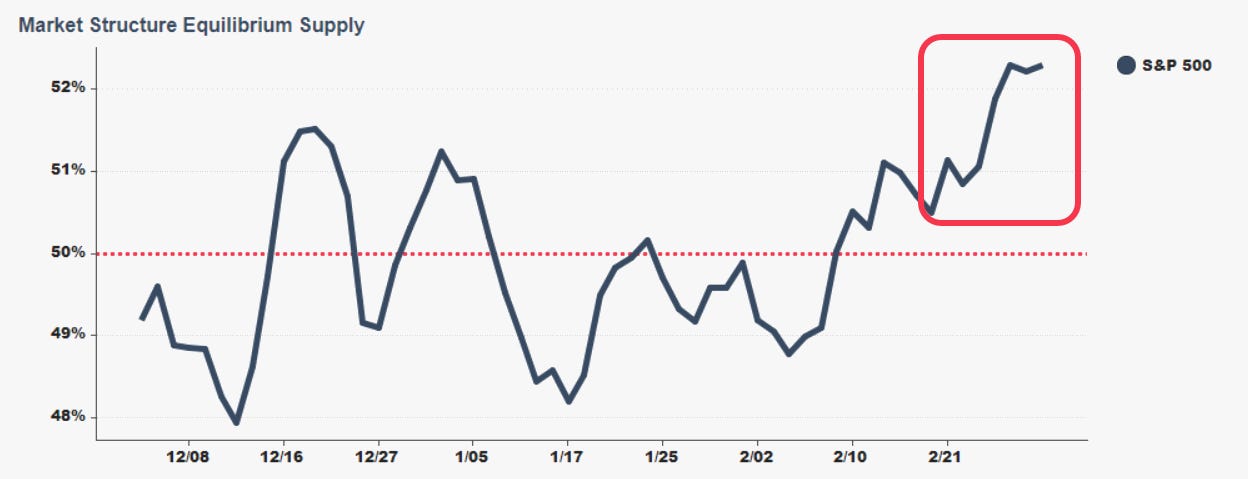
High levels of supply over 50% signal bearish market participant behavior - an important input to trade strategy decisions.
A stock’s demand-supply distance to equilibrium can be observed and classified into market structure quadrants of strength, weakness, muted upside, and muted downside. The following analytic captures market structure equilibrium information value.
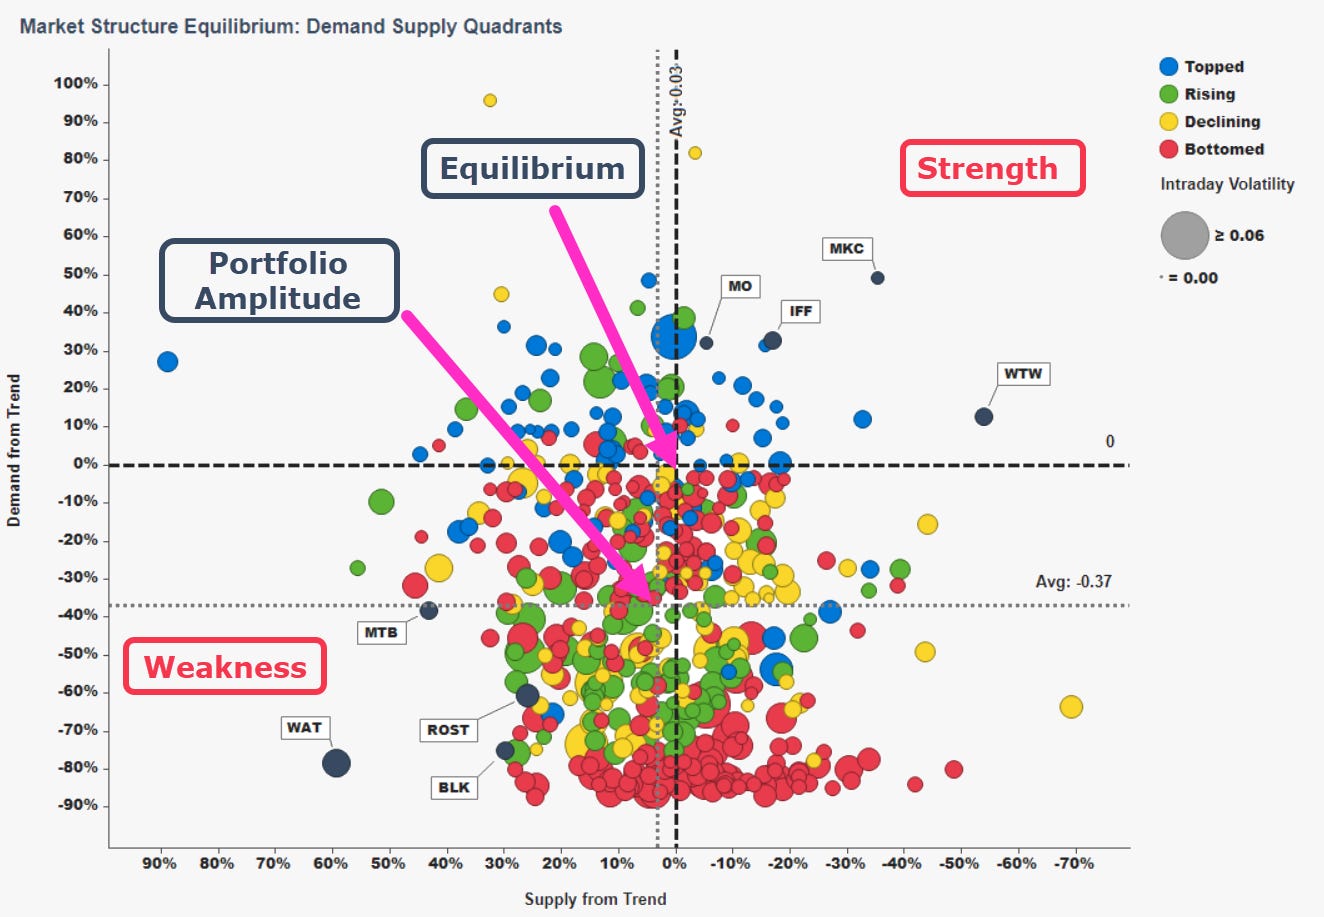
Market Behavior Demand Supply Quadrants
Each marker is a symbol
Symbols are sized by intraday volatility
Symbols are colored by demand state
Equilibrium: is where current demand and supply meet 30-day demand and supply
Y-axis: current demand minus 30-day demand
X-axis: current supply minus 30-day supply (inverted)
Amplitude is distance from equilibrium
Quadrants
Strength: high demand, low supply
Muted Upside: high demand, high supply
Muted Downside: low demand, low supply
Weakness: low demand, high supply
Market behavior information asymmetry.
Earnings
Knowns: sell-side earnings estimates, earnings reports, post-earnings performance.
Known-unknowns: alternative earnings estimates, revisions, and trends, statistical measures of earnings beat and miss materiality, and post-earnings drift performance attribution.
Unknown-unknown: post-earnings drift classification scores.
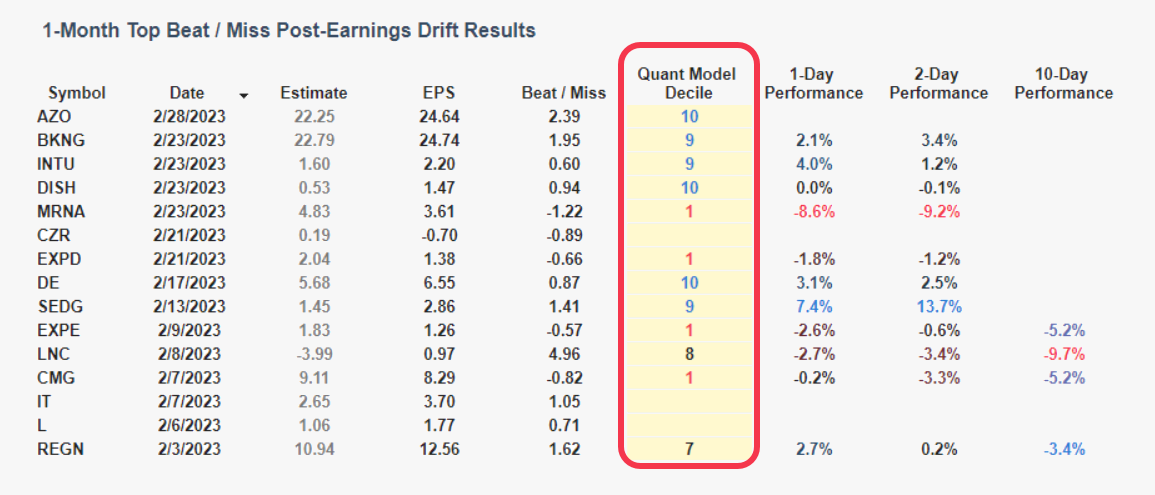
Our post-earnings drift quantitative model is built with earnings unknowns: alternative earnings estimates quantitatively superior to traditional estimates. Each earnings release is classified into one of ten deciles based on the statistical meaningfulness of the earnings report beat or miss.
In February, seven S&P 500 earnings reports were classified into the most extreme earnings surprise deciles, 1 and 10. The 2-day post-earnings drift performance difference between the deciles was 270 basis points (10th decile: +2.7%, 1st decile: 0.0%). The spread was 290 basis points over ten days (10th decile -1.3%, 1st decile: -4.2%).
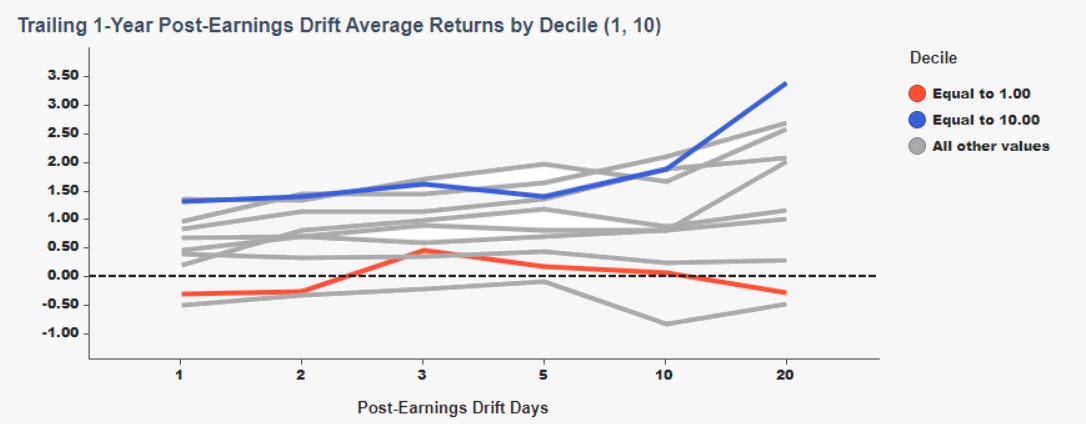
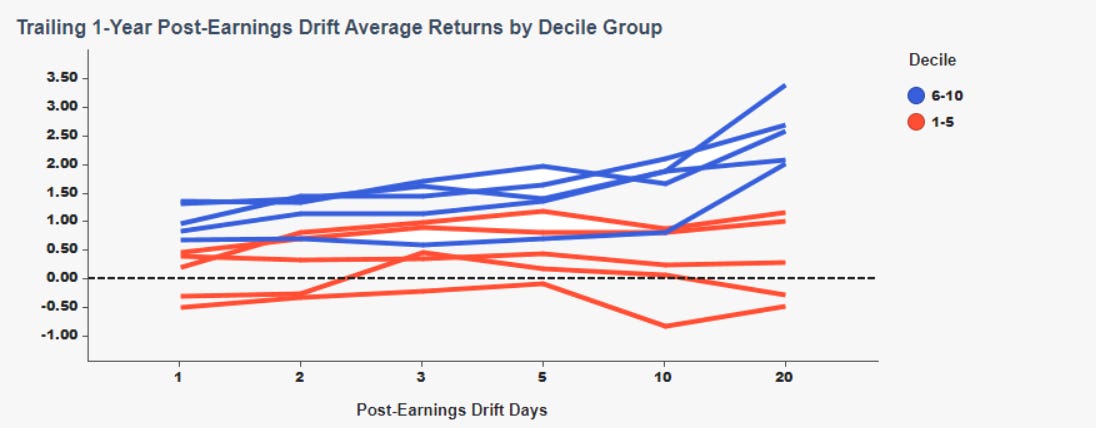
More broadly, across nearly 1,500 companies for which we have alternative estimate data, our post-earnings drift model produced the following results.
439 earnings reports (10.5%) were classified in decile 10, with an average 20-day post-earnings-drift performance of 3.39%.
402 earnings releases (9.5%) were classified in decile 1, with an average 20-day post-earnings-drift performance of -0.27%.
A difference of 366 basis points.
Post-earnings drift quantitative deciles and performance should not be unknown.
Earnings information asymmetry.
News Sentiment
Knowns: news stories and activity.
Known-unknowns: natural language processed (NLP) news sentiment scores and activity alerts.
Unknown-unknown: Portfolio performance of NLP classified sentiment scores.
Our news sentiment analytic combines NLP scored headlines and activity with traditional pricing and technical indicators. Combining AI level information with standard financial information is like adding the unknown to the known to create an unknown-unknown.
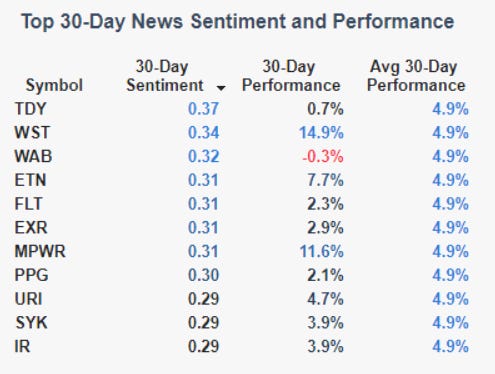
TDY is the top scored 30-day news sentiment stock from the S&P 500.
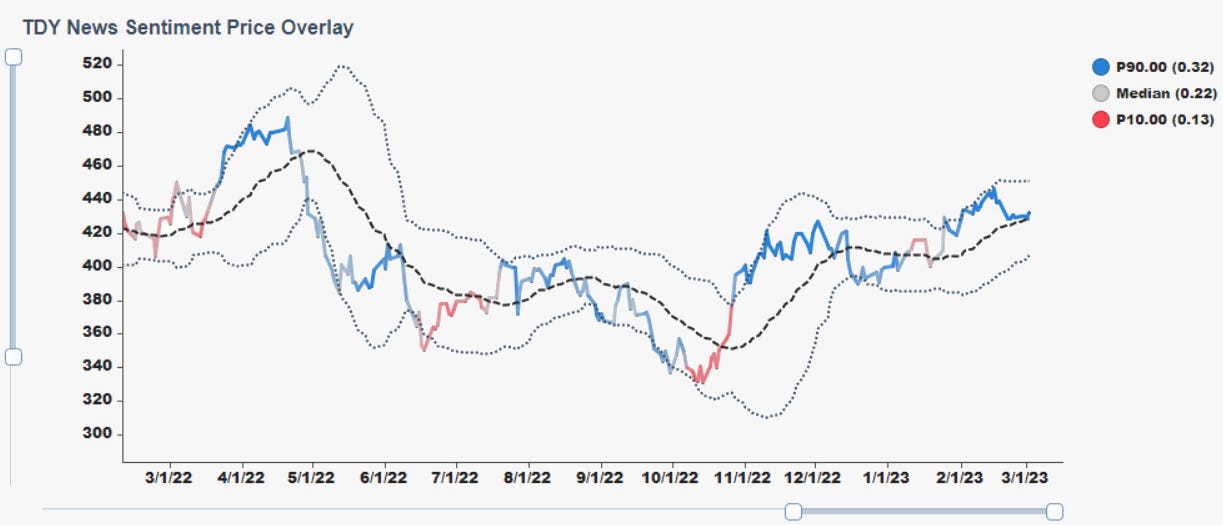
The 30-day average news sentiment score across the S&P 500 is 0.13 (symbol level sentiment oscillates between -1 and +1). The S&P 500 30-day performance is down 2.5%.
The S&P 500 top-10 news sentiment stocks have 30-day scores ranging from 0.29 to 0.37. Their 30-day average performance is 4.9%.
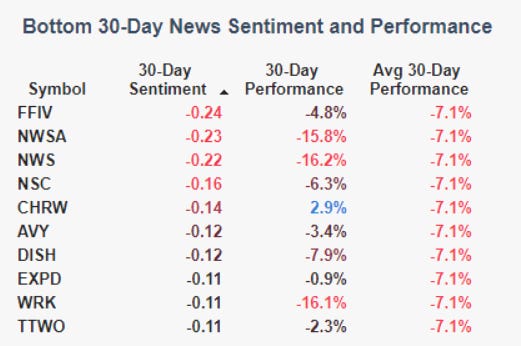
The S&P 500 bottom-10 news sentiment stocks have 30-day scores ranging from -0.11 to -0.24. Their 30-day average performance is -7.1%.
News sentiment information asymmetry.
For as long as markets have existed there has been information asymmetry. And as markets evolve so does its information. Our knowledge also evolves. Gradually, then suddenly. Small changes to information knowledge can have a large impact on risk management and performance.
A mouse in a maze seeks its known-unknown, the location of cheese. But a greater blind spot exists. Its unknown-unknown is the human measuring the mouse’s ability to find the cheese.
If the mouse saw its blind spot, it would probably be shocked.
Wouldn’t we be shocked to see ours?
Adapted from Richard Feynman’s quote, “I'm smart enough to know that I'm dumb.”
.png)


